We apologize for the inconvenience, but Data for Housing will not be continuing for the year of 2021. Join the waitlist at the top to learn when we will be planning our next workshop.
Workshop Week 1
Data Science Principles, Python, & Visualizations
-
Data Science Principles
Ask and answer the right questions to improve your analytics. Our workshop will bring you up to date on what urban scholars and practitioners are doing to make new breakthroughs in research.
-
Big Data
Big data is not exclusive to the private sector. Use large volumes of data to automate processes and monitor progress on your projects.
-
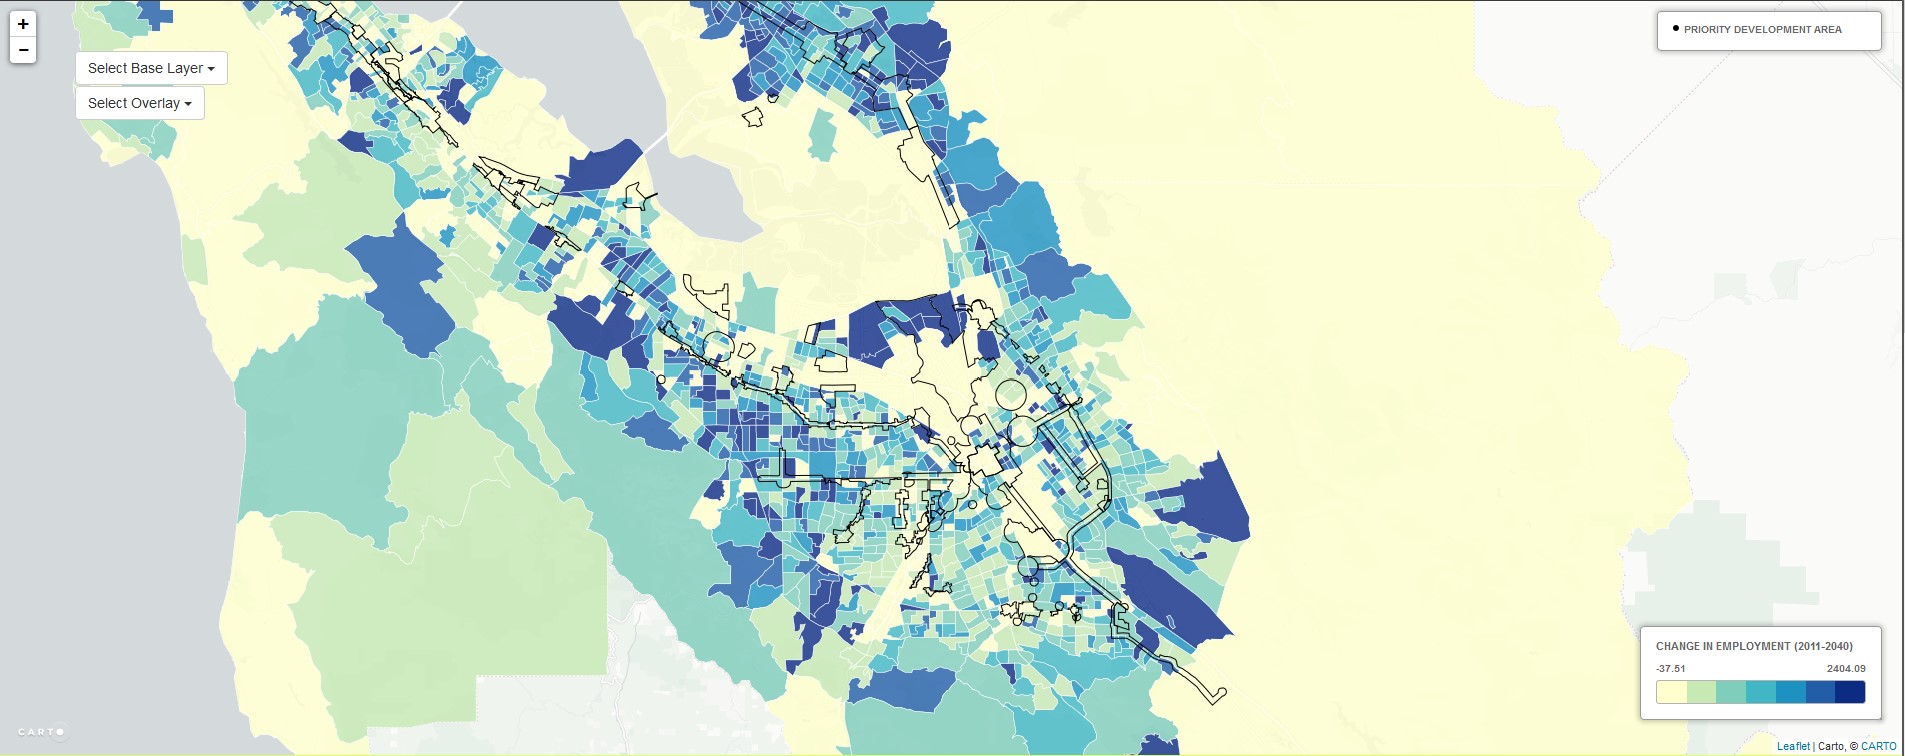
Visualizations
Use mapping and other visualization packages to drive your findings home and engage the public more effectively.
-
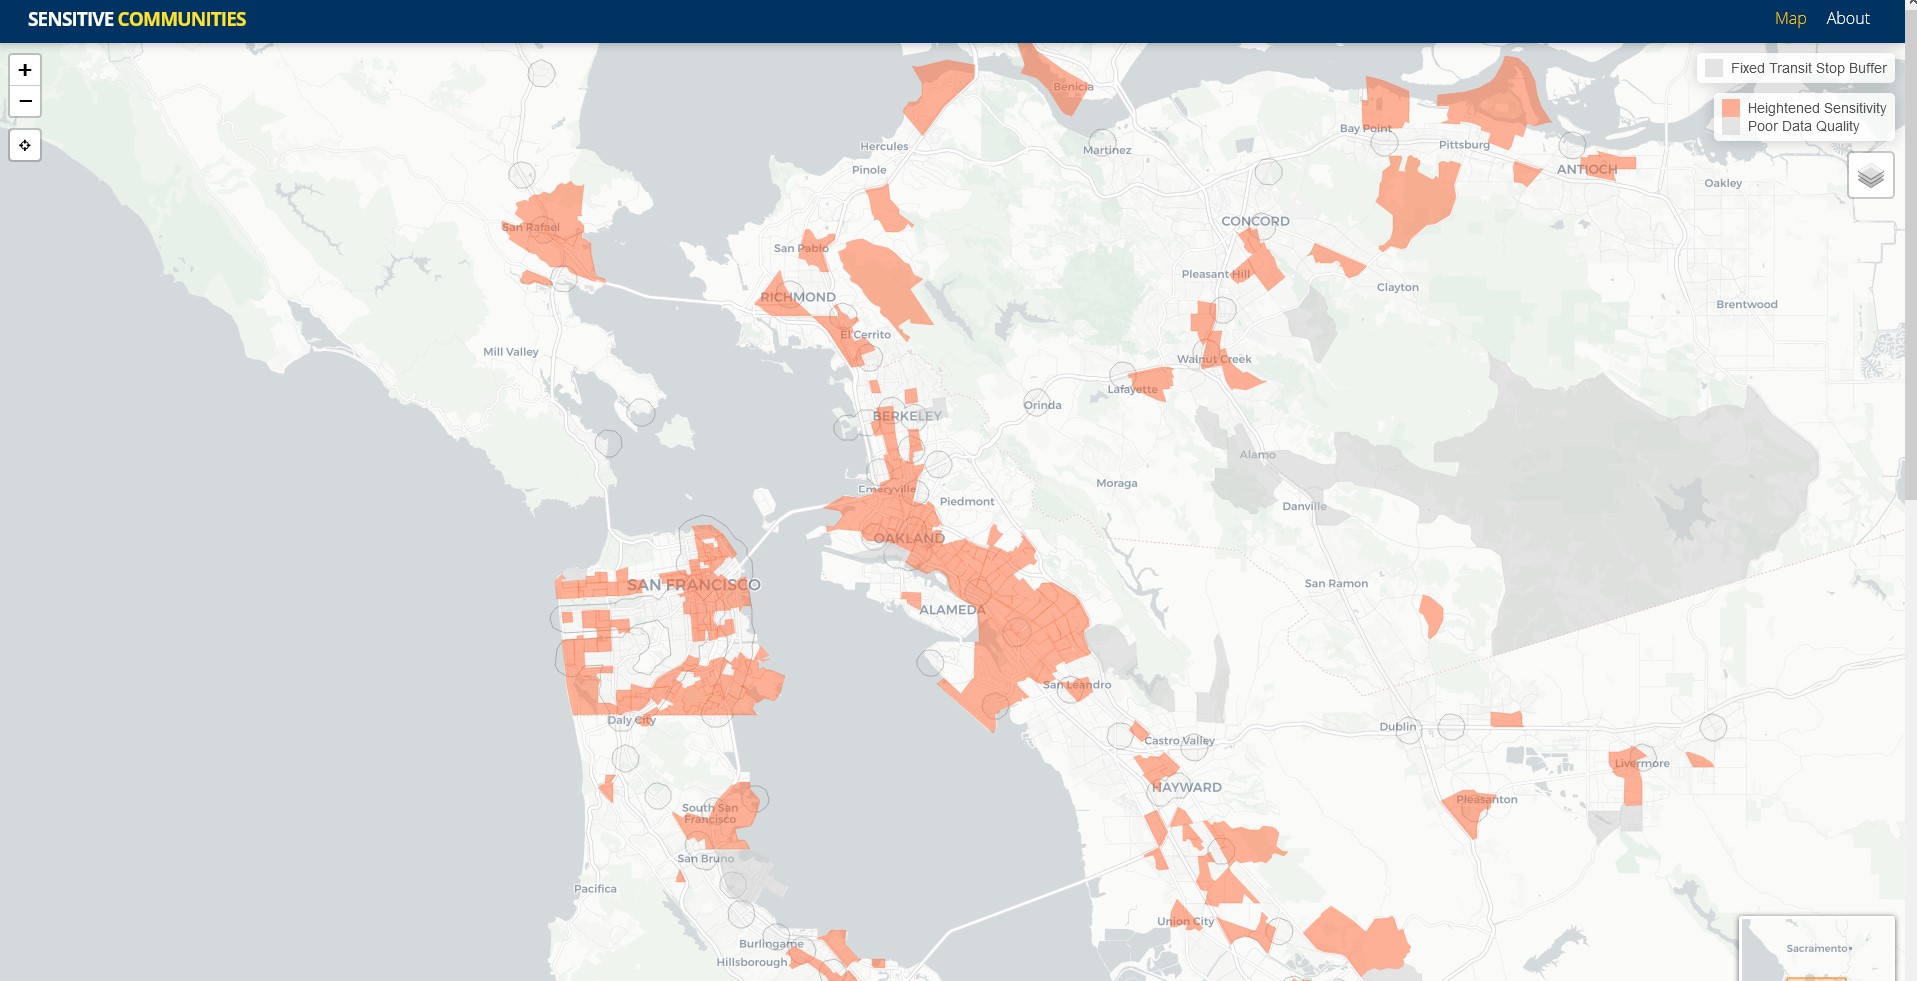
Mapping
Mapping is integral to planning. Before, we had to rely on high cost mapping software to build our spatial analysis. Now we can use open source software and code to produce maps at scale.
Workshop Week 2
Advanced Visualizations & Machine Learning
-
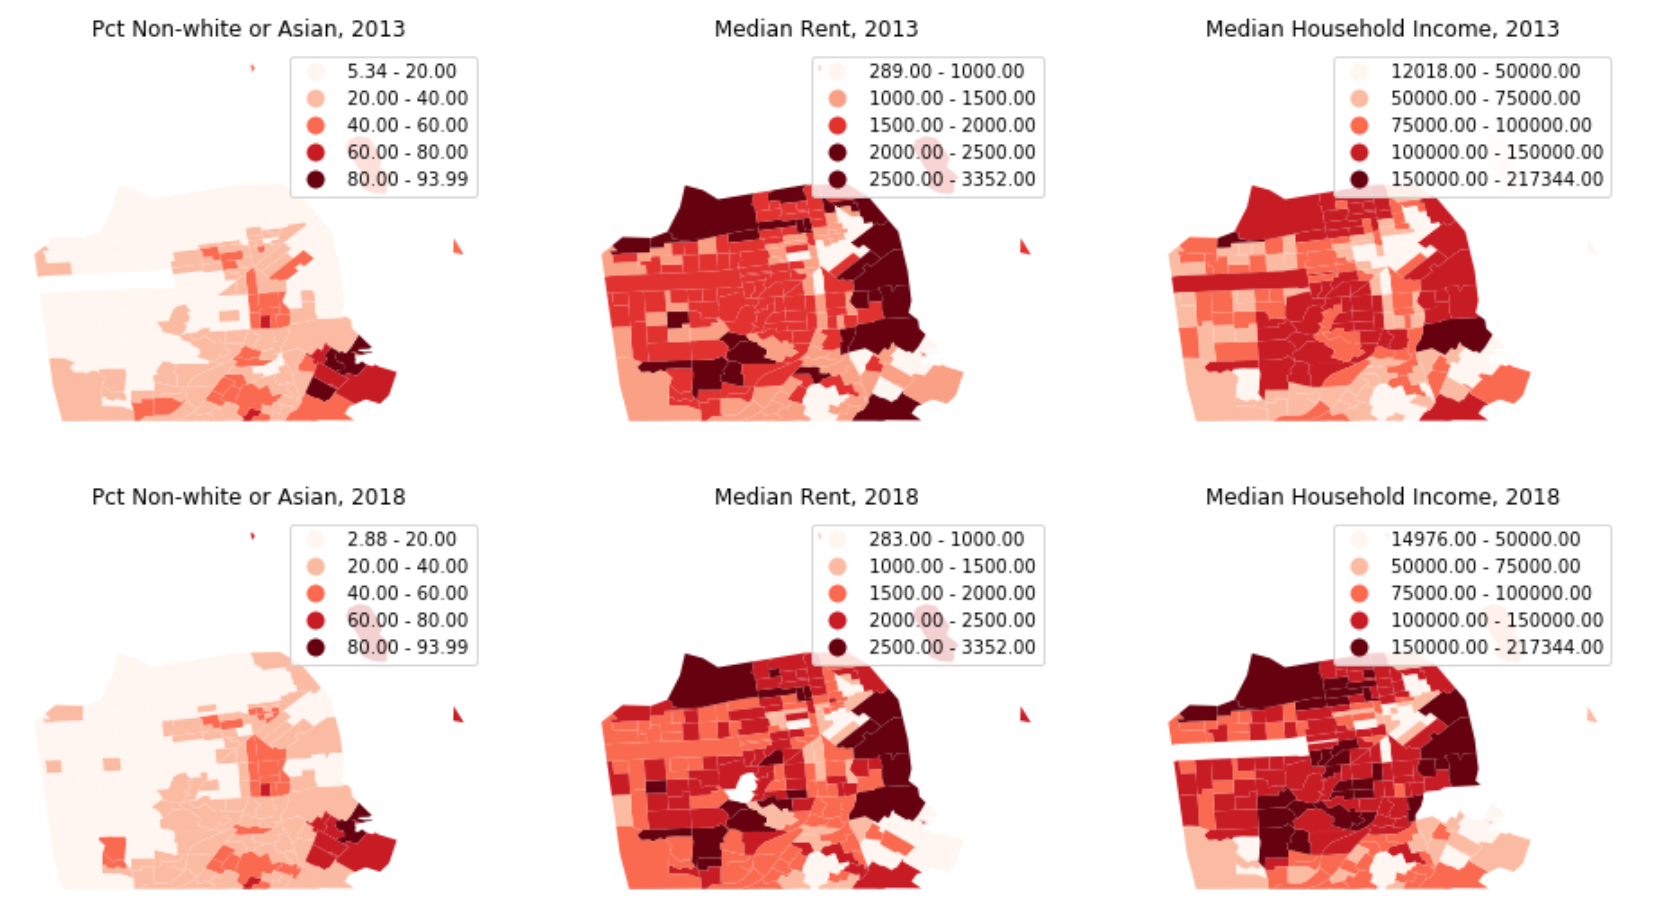
Advanced Visualizations
Move beyond simple graphs and charts and learn creative new ways to spread knowledge about your analysis from the previous workshop.
-
Machine Learning
Learn cutting edge machine learning techniques to be able to build new datasets and analyze data in innovative ways.
Pricing
Program costs differ by organization type. We also offer discounts. An early bird discount* of 10% applies to all who apply before March 13, 2020. In addition, we offer a “buddy discount”: if both you and one or more of your colleagues sign up, we offer a discount of 40% (see below). Finally, for those with special hardships, we will be providing scholarships to attend the training.
| Organizational Type |
Price |
Discounted Price |
| Private/Individual |
$5,000 |
$3,000 |
| Public/Government |
$2,500 |
$1,500 |
| Non-Profit |
$500 |
$300 |
*Early bird discount is applied at checkout and will be reduced from your entry.
Future Workshops
We will not be hosting a workshop for the year of 2021. We do hope to provide an improved experience in the near future. By pressing the apply button on top, we will put you on our member listserv and keep you updated on workshops in the future.